Smart City Digital Twin
SensUrban Digital Twin — Strategic Asset of Smart City
We believe that smart cities are not just about technology, but about improving the quality of life for everyone. SensUrban's platform assists in tackling challenges like urban sprawl, energy efficiency, and infrastructure planning, thereby contributing to sustainability goals. By enabling a deeper understanding of city dynamics, we facilitate informed decision-making that leads to economic growth, environmental sustainability, and improved living standards. That is what makes the digital twin a strategic asset for any smart city.
Join us in making our cities not only more intelligent, but also more livable, enjoyable, and sustainable. Experience the future of urban living with SensUrban.
The Platform
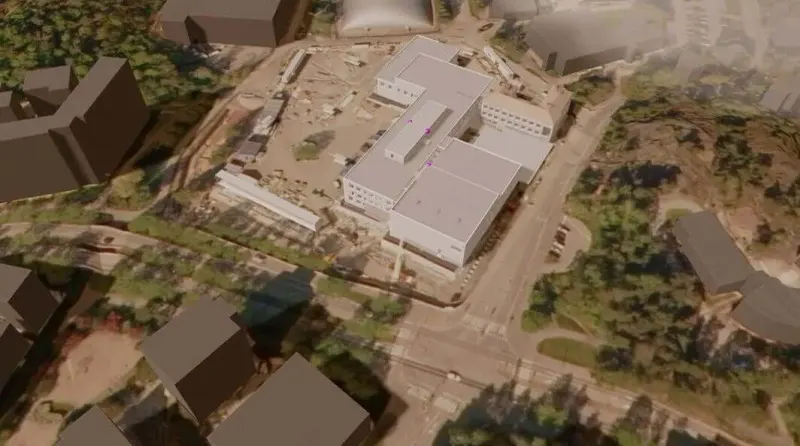
The SensUrban based Digital Twin reflects real life, real-time events in 3D Virtual Reality
SensUrban provides tools, ecosystem and environment for stakeholders to deploy various applications and data visualizations on 3D digital twins.
Advanced data visualization with countless layers of information for Smart City and Smart Buildings
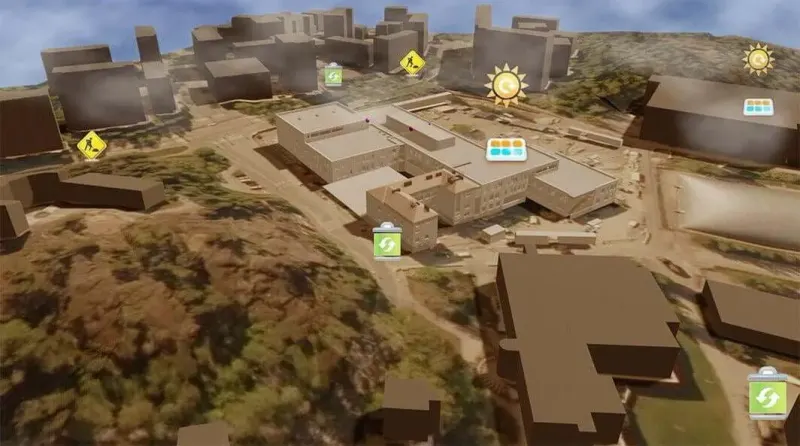
The SensUrban platform enables immersive visualization of different layers of information on an intuitive 3D building/city model and browser-based user interface, such as:
- HVAC and other building automation data
- Energy consumption, energy efficiency and carbon footprint of building(s)
- Water consumption, electricity consumption
- Operation and energy efficiency of local energy production
- IoT sensor data, e.g. room air condition and quality, building moisture, room occupancy and use
- Analyzed building risks, e.g. mold risk index, areas at risk of capillary moisture, indoor air quality index
- User-generated data, e.g. tenant feedback, workforce management
- Traffic weather, traffic flow and parking lot data
- Water network, sewage network, district heating network
- Outdoor air quality in cities, pollution level and local weather
SensUrban Digital Twin 3D models are tailored to customer needs.
Applications
One platform, countless smart city applications
SensUrban turns complex urban and building data into intuitive, immersive 3D visualizations — across every domain of the smart city.
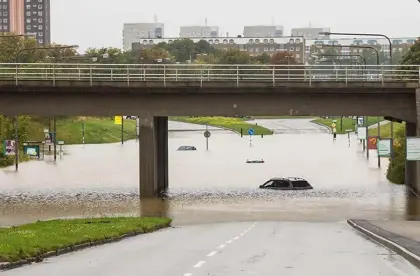
Environment
Visualize weather, flooding and environmental risk across the city in real time on a living 3D model.
Learn more
Intelligent Traffic
Monitor traffic flow, parking, autonomous mobility and traffic weather as it happens.
Learn more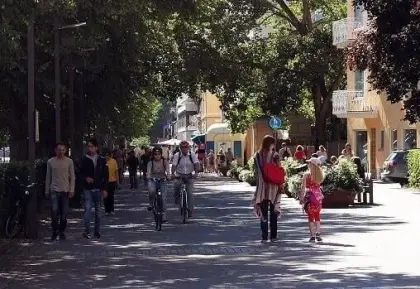
People Flow
Understand how people move through buildings and public spaces to optimize comfort and capacity.
Learn more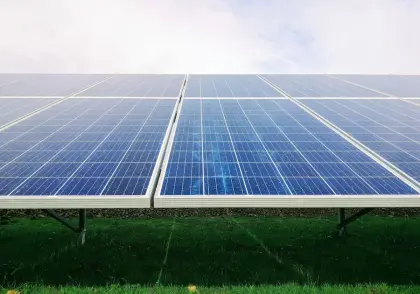
Energy Efficiency
Track energy consumption, local production and carbon footprint to drive efficiency.
Learn more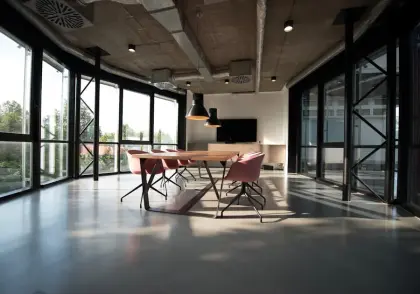
Space Usage
Analyze room occupancy and space utilization to make the most of every square meter.
Learn more
Air Quality
Surface indoor and outdoor air quality, pollution levels and ventilation performance.
Learn more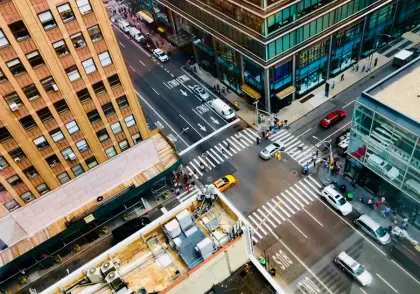
Featured Customer
FeelPlace — Building's IoT Data Visualization
IoT data visualization in a 3D model
FeelPlace IoT Solutions for buildings consist of different types of IoT devices, cloud-based data storage and data analysis systems. The FeelPlace IoT data as well as local weather information are integrated (using APIs) into the 3D model of the building by SensUrban software, running in the client web browser (Chrome/Edge). The end result is a browser-based, easy-to-use, highly visual smart building user interface for IoT data visualization, co-branded by FeelPlace as FeelPlace3D.
www.feelplace.com