Applications
Energy Efficiency Visualization for Buildings and Cities
Track energy consumption, local production and carbon footprint to drive efficiency. SensUrban layers energy data from building automation, meters and local production onto a 3D digital twin — making the energy performance of every building visible, comparable and actionable for owners, operators and cities.
What you can visualize
SensUrban brings the energy-related data layers of buildings and districts onto one 3D view:
- Energy consumption, energy efficiency and carbon footprint of buildings
- Electricity and water consumption per building, floor or zone
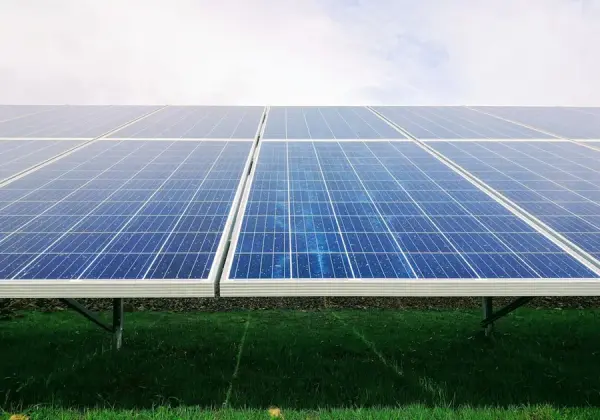
- Operation and energy efficiency of local energy production, such as solar
- HVAC and other building automation data behind the consumption figures
- District heating network as a layer of the city model
- Indoor conditions alongside energy use, to balance efficiency with comfort
SensUrban Digital Twin 3D models are tailored to customer needs.
Why visualize energy efficiency on a digital twin
Find the Waste
When consumption is shown building by building on the 3D model, outliers and anomalies stand out immediately — and savings can be targeted where they matter.
Carbon Visibility
Make the carbon footprint of buildings a visible, shared metric for owners, tenants and city sustainability programs.
Production Meets Consumption
See local energy production and consumption side by side to evaluate self-sufficiency and the performance of energy investments.
Efficiency Without Sacrificing Comfort
Combining energy data with indoor conditions and occupancy shows whether savings measures hold up where people live and work.
How it works
SensUrban provides the tools, ecosystem and environment to deploy this application on a 3D digital twin.
Connect Your Data
IoT sensors, building systems, city services and open data sources are integrated into the platform via APIs — SensUrban is data-source neutral.
See It in 3D
The data becomes living layers on a 3D digital twin tailored to your city, district or building, running in a standard web browser.
Decide and Act
Real-time and historical views give operators, planners and decision-makers a shared, intuitive basis for action.
Frequently asked questions
Which energy data can SensUrban visualize?
Energy consumption, energy efficiency and carbon footprint of buildings, electricity and water consumption, the operation and efficiency of local energy production, and HVAC and building automation data — all integrated from your existing systems via APIs.
Can we compare buildings against each other?
Yes. Because each building on the 3D model carries its own data layers, portfolio owners and cities can compare energy performance across buildings and districts at a glance.
Does SensUrban replace our building automation system?
No — it complements it. Your building automation and metering systems remain the source of truth; SensUrban integrates their data via APIs and turns it into an intuitive 3D visualization for a much wider audience.
How does this support sustainability reporting?
The digital twin makes energy and carbon data continuously visible rather than buried in annual reports. It is a powerful way to communicate progress on efficiency and emission goals to stakeholders.
Explore more applications
One platform, countless smart city applications — all on the same 3D digital twin.