Applications
People Flow Visualization for Buildings and Public Spaces
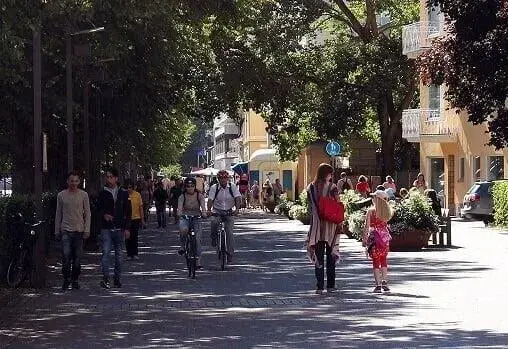
Understand how people move through buildings and public spaces to optimize comfort and capacity. SensUrban visualizes people flow, room occupancy and space-use data from IoT sensors on a 3D digital twin — people flow analytics that turn anonymous counting data into a clear, living picture of how spaces are actually used.
What you can visualize
People flow data from your sensors and systems becomes an intuitive occupancy layer on the 3D model:
- Room occupancy and use across floors, zones and buildings
- Movement of people through entrances, corridors and public spaces
- Capacity and utilization compared against design limits
- Occupancy patterns over time — peak hours, quiet periods and trends
- User-generated data such as tenant feedback, linked to the spaces it concerns
- Indoor conditions alongside occupancy, to connect comfort with use
SensUrban Digital Twin 3D models are tailored to customer needs.
Why visualize people flow on a digital twin
Right-Sized Spaces
See which areas are crowded and which stand empty, and adapt layouts, services and cleaning schedules to real demand.
Comfort and Safety
Combine occupancy with indoor conditions to keep ventilation, temperature and capacity in balance where people actually are.
Evidence for Decisions
Occupancy history on the digital twin gives facility owners concrete evidence for space investments and service design.
Privacy by Design
SensUrban visualizes anonymous counting and occupancy data from your sensors — flows and volumes, not identities.
How it works
SensUrban provides the tools, ecosystem and environment to deploy this application on a 3D digital twin.
Connect Your Data
IoT sensors, building systems, city services and open data sources are integrated into the platform via APIs — SensUrban is data-source neutral.
See It in 3D
The data becomes living layers on a 3D digital twin tailored to your city, district or building, running in a standard web browser.
Decide and Act
Real-time and historical views give operators, planners and decision-makers a shared, intuitive basis for action.
Frequently asked questions
What kind of sensors does people flow visualization use?
SensUrban visualizes occupancy and people counting data produced by your building's IoT sensors and systems, integrated via APIs. The platform works with the people counting technology you choose — it renders the resulting data on the 3D model.
Is individual movement tracked?
No. The visualization is based on anonymous occupancy and counting data — how many people are in a space and how flows develop over time, not who they are.
Can people flow be combined with other building data?
Yes, that is the core idea of the digital twin: occupancy can be viewed together with indoor air quality, HVAC status, energy use and tenant feedback on the same 3D model of the building.
Does this work for public spaces as well as buildings?
Yes. SensUrban 3D models are tailored to customer needs and can cover indoor spaces, campuses, public areas or whole districts — people flow layers are placed wherever counting data is available.
Explore more applications
One platform, countless smart city applications — all on the same 3D digital twin.