Applications
Environmental Monitoring on a Smart City Digital Twin
Visualize weather, flooding and environmental risk across the city in real time on a living 3D model. SensUrban layers environmental data from IoT sensors, municipal systems and open data sources onto an intuitive, browser-based 3D digital twin — so planners, operators and decision-makers share one clear picture of the urban environment.
What you can visualize
SensUrban integrates environmental data through APIs and renders it as living layers on a tailored 3D model of your city or district:
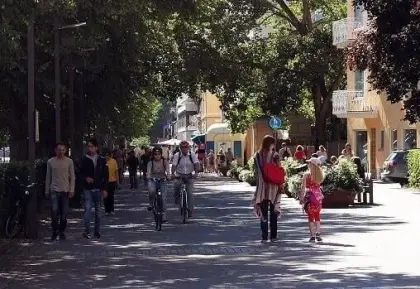
- Local weather and traffic weather conditions in real time
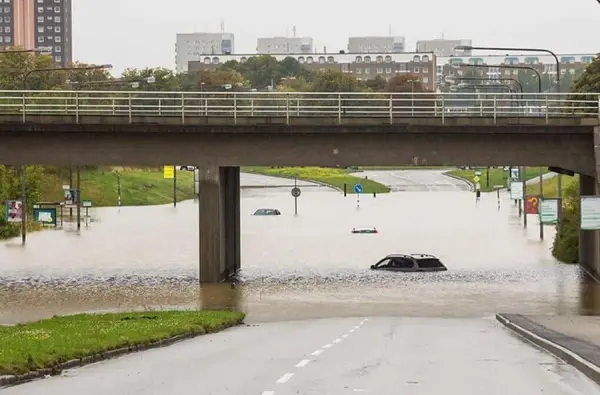
- Flooding and stormwater risk areas mapped onto terrain and buildings
- Building moisture and analyzed risks such as mold risk index and areas at risk of capillary moisture
- Water network, sewage network and district heating network layers
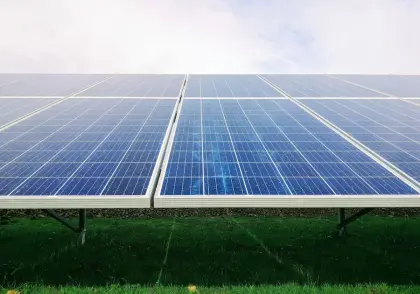
- Outdoor air quality and pollution levels across the city
- Readings from environmental IoT sensors, positioned exactly where they are installed
SensUrban Digital Twin 3D models are tailored to customer needs.
Why visualize environment on a digital twin
Early Risk Awareness
See developing weather and flood situations on the city model as they happen, instead of piecing them together from separate systems and spreadsheets.
One Shared Picture
City departments, utilities and emergency services look at the same live 3D view in a standard web browser — no specialist software to install.
From Data to Intuition
Environmental measurements become instantly understandable when they are shown on the actual streets, buildings and waterways they concern.
Climate Adaptation Planning
Use the digital twin to communicate environmental risks and adaptation plans to stakeholders and residents in a visual, concrete way.
How it works
SensUrban provides the tools, ecosystem and environment to deploy this application on a 3D digital twin.
Connect Your Data
IoT sensors, building systems, city services and open data sources are integrated into the platform via APIs — SensUrban is data-source neutral.
See It in 3D
The data becomes living layers on a 3D digital twin tailored to your city, district or building, running in a standard web browser.
Decide and Act
Real-time and historical views give operators, planners and decision-makers a shared, intuitive basis for action.
Frequently asked questions
What environmental data sources can SensUrban visualize?
SensUrban integrates data through APIs, so it can visualize information from environmental IoT sensors, weather services, municipal water and sewage network systems, and open data sources. The platform is data-source neutral — if your system can share data over an API, it can become a layer on the digital twin.
Is the environmental view real-time?
Yes. The SensUrban digital twin reflects real-life, real-time events in 3D. Data layers update as new measurements arrive from the connected sources, so the city model shows current conditions, not yesterday's report.
Do we need to buy new sensors to get started?
No. SensUrban visualizes data from the sensors and systems you already operate, complemented with open data such as weather services. If you need additional measurement coverage, the platform works with third-party IoT sensors integrated via APIs.
How is the 3D model of our city created?
SensUrban digital twin 3D models are tailored to customer needs. The model can cover a single building, a district or a wider city area, and it runs in a standard web browser (Chrome/Edge) without separate client software.
Explore more applications
One platform, countless smart city applications — all on the same 3D digital twin.