Applications
Intelligent Traffic Monitoring on a Live 3D City Model
Monitor traffic flow, parking, autonomous mobility and traffic weather as it happens. SensUrban brings the data streams of intelligent transportation systems together on one immersive 3D digital twin, giving traffic operators and urban planners a real-time, bird's-eye understanding of how the city moves.
What you can visualize
SensUrban turns the feeds of your traffic and mobility systems into intuitive layers on the 3D city model:
- Traffic flow conditions on streets and road networks in real time
- Parking lot and parking area occupancy data
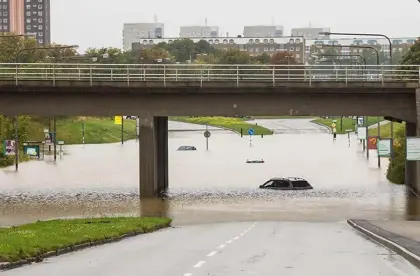
- Traffic weather — road surface and driving conditions across the network
- GPS positions of tracked vehicles and mobile assets
- Data streams supporting autonomous mobility pilots and services
- Local weather conditions affecting traffic, layered on the same view

SensUrban Digital Twin 3D models are tailored to customer needs.
Why visualize intelligent traffic on a digital twin
Situational Awareness
Operators see congestion, parking pressure and deteriorating road weather on one live city model instead of monitoring separate dashboards.
Faster, Better Decisions
When traffic data is shown on the actual street network in 3D, patterns and problem spots are recognized at a glance.
Planning with Evidence
Replay and analyze how traffic behaves over time to support infrastructure planning, parking policy and mobility investments.
Open to Your Systems
SensUrban integrates traffic data via APIs, so existing ITS platforms, parking systems and fleet trackers keep doing their job — the twin makes their data visible.
How it works
SensUrban provides the tools, ecosystem and environment to deploy this application on a 3D digital twin.
Connect Your Data
IoT sensors, building systems, city services and open data sources are integrated into the platform via APIs — SensUrban is data-source neutral.
See It in 3D
The data becomes living layers on a 3D digital twin tailored to your city, district or building, running in a standard web browser.
Decide and Act
Real-time and historical views give operators, planners and decision-makers a shared, intuitive basis for action.
Frequently asked questions
Where does the traffic data come from?
From the systems you already operate. SensUrban integrates traffic flow data, parking systems, road weather services and vehicle GPS tracking via APIs and visualizes them as layers on the 3D city model. The platform itself is data-source neutral.
Can we see parking occupancy on the model?
Yes. Parking lot data is one of the standard information layers of the SensUrban platform — occupancy from connected parking systems is shown directly on the parking areas of the 3D model.
Does SensUrban support traffic weather monitoring?
Yes. Traffic weather is a core data layer: road and driving conditions from weather services and road sensors are visualized across the street network, helping operators anticipate and react to changing conditions.
Who uses the traffic view?
Typical users are city traffic management, urban planners and mobility service operators. Because the digital twin runs in a standard web browser, the same live view can be shared across organizations without installing software.
Explore more applications
One platform, countless smart city applications — all on the same 3D digital twin.