Applications
Space Usage Analytics on a 3D Building Twin
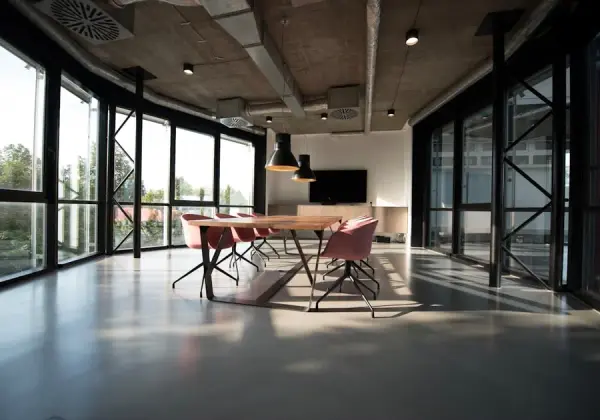
Analyze room occupancy and space utilization to make the most of every square meter. SensUrban visualizes how rooms, desks and shared spaces are actually used — directly on a 3D model of your building — so facility owners and workplace managers can base space decisions on reality instead of assumptions.
What you can visualize
Space usage data from IoT sensors and workplace systems becomes a living layer of the building's digital twin:
- Room occupancy and use across every floor and zone
- Utilization rates of meeting rooms, workstations and shared spaces
- Usage patterns over time — daily, weekly and seasonal variation
- User-generated data such as tenant feedback and workforce management information
- Indoor conditions in each space, viewed together with its usage
- Underused and overbooked areas highlighted on the 3D model
SensUrban Digital Twin 3D models are tailored to customer needs.
Why visualize space usage on a digital twin
Every Square Meter Counts
Identify chronically underused rooms and floors, and turn that insight into consolidation, subletting or redesign decisions.
Workplace Experience
Match the supply of meeting rooms and quiet spaces to demonstrated demand instead of complaints and guesswork.
Cost Transparency
Space is one of the largest costs of any organization. Utilization data on the twin shows what you actually get for it.
One Model, Many Stakeholders
Facility management, HR and leadership all read the same browser-based 3D view — no specialist reporting tools required.
How it works
SensUrban provides the tools, ecosystem and environment to deploy this application on a 3D digital twin.
Connect Your Data
IoT sensors, building systems, city services and open data sources are integrated into the platform via APIs — SensUrban is data-source neutral.
See It in 3D
The data becomes living layers on a 3D digital twin tailored to your city, district or building, running in a standard web browser.
Decide and Act
Real-time and historical views give operators, planners and decision-makers a shared, intuitive basis for action.
Frequently asked questions
How is space usage measured?
Through the occupancy and IoT sensors deployed in your building, integrated to SensUrban via APIs. The platform visualizes the resulting room occupancy and use data on the 3D model — it is independent of any single sensor vendor.
What is the difference between space usage and people flow?
People flow focuses on how people move through buildings and public spaces; space usage focuses on how rooms and areas are occupied and utilized over time. On the digital twin they are complementary layers, often used together.
Can tenant feedback be shown on the model?
Yes. User-generated data such as tenant feedback and workforce management information is one of the platform's standard data layers, linked to the spaces it concerns.
We have several buildings — can we see them all?
Yes. SensUrban 3D models are tailored to customer needs and can cover a single building, a campus or a portfolio, with utilization data per building, floor and room.
Explore more applications
One platform, countless smart city applications — all on the same 3D digital twin.